October 14 - PRESS CALL - INCREASED HOSPITALIZATIONS & RECORD NUMBER OF COVID-19 CASES IN DOZENS OF STATES; DATA CHALLENGES, THE UPCOMING ELECTION AND FEDERAL ACTION
Earlier today, CovidExitStrategy.org, United States of Care, Resolve to Save Lives, U.S. Digital Response, and the Duke-Margolis Center for Health Policy held a press webinar outlining new data on COVID-19 hospitalizations, data challenges, the upcoming election and steps the federal government can take to provide COVID relief.
You can view the video of the press conference here.
October 12 - Adding Mask Wearing Data & Community Spread Data from CMU Delphi Surveys
We've updated our "How is the Disease Spreading" table to include the "% of people wearing masks most or all of the time while in public" and "% of people who know someone in their local community with COVID-like symptoms". This data is from the daily survey run by CMU's Delphi group. Over 1.2 million people have taken the survey in the last 30 days. Amounting to about 70K people daily.
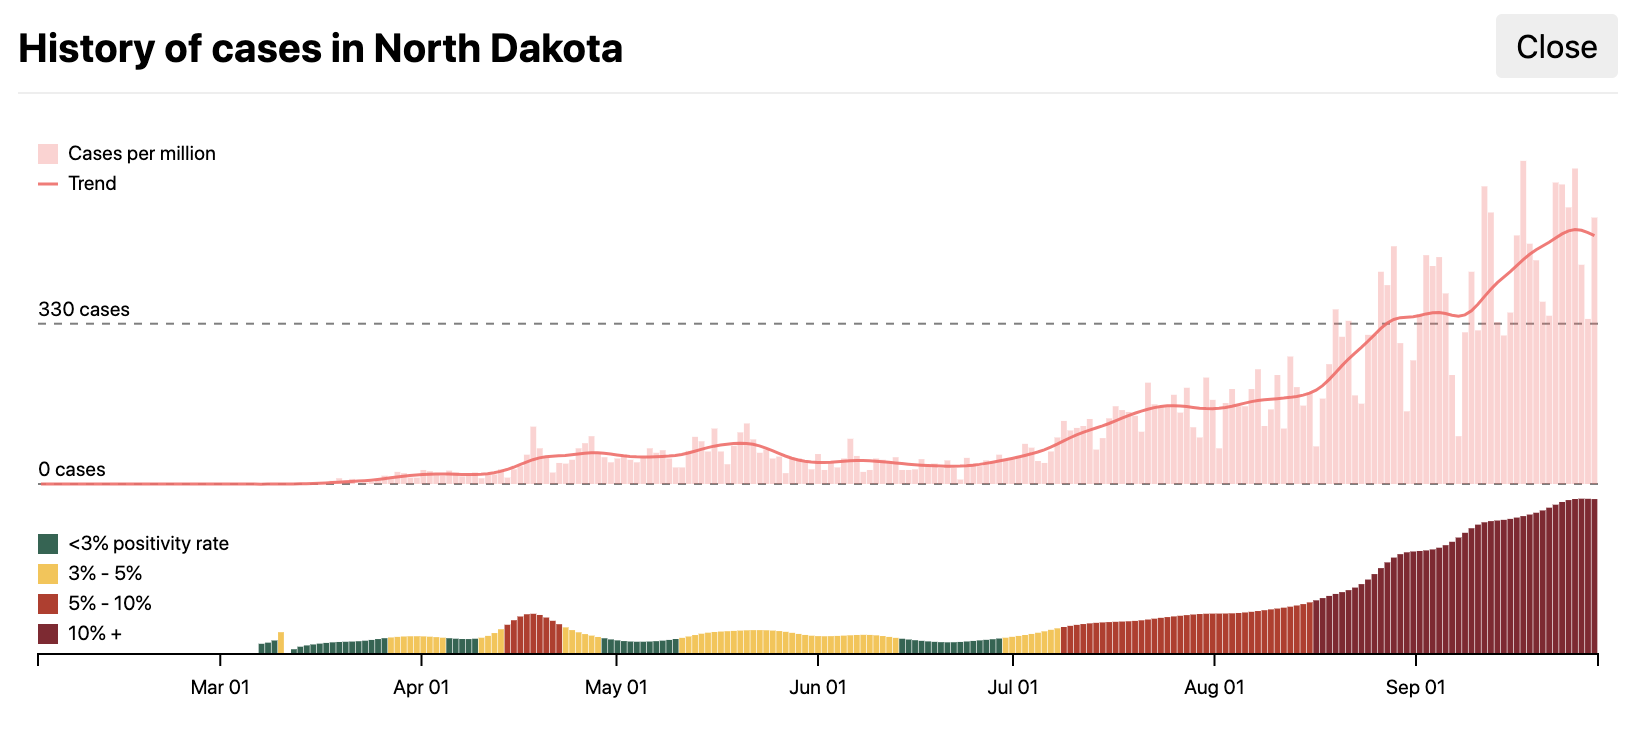
October 1 - Click on Main Map for Timeline of Cases & Positivity for Each State
We've updated our main map to show you a timeline of CASES PER MILLION and POSITIVITY since the start of this crisis. Click on a state, and you will see:
September 21 - Op-Ed: The White House Coronavirus Task Force needs to stop hiding its weekly reports from the public
Like a hurricane, a virus has no respect for borders or state lines. All data regarding the COVID response that is assembled by the White House Coronavirus Task Force and HHS must be shared with everyone. A public crisis requires a unified public response. A unified public response requires public data.
Read the full op-ed at STAT.
September 17 - PRESS CALL - COVID-19 SPREAD INDICATORS UNDER FIRE, WHAT TO WATCH BETWEEN NOW AND NOVEMBER, COLLEGE SPORTS, & PREPARING FOR FLU SEASON
Earlier today, CovidExitStrategy.org, United States of Care, Resolve to Save Lives, COVID Act Now, and the Duke-Margolis Center for Health Policy held a press webinar outlining new data on COVID-19 spread indicators, college hotspots and addressed how states can prepare for flu season.
You can view the video of the press conference here.
September 1 - Carnegie Mellon University's Symptom Survey & Symptom Data Challenge
We have added symptom data from Carnegie Mellon University's Delphi group. The group coordinates a daily symptom survey with Facebook, a consortium of universities, and public health officials. It has run continuously since early April 2020, and about 70,000 people in the United States participate every day. You will see this data in our "How is the Disease Spreading?" table.
Also! The Symptom Data Challenge challenges participants to enable earlier detection and improved situational awareness of the COVID-19 outbreak by using data from these symptom surveys. Submissions are due by Tuesday, September 29th, 2020. See the challenge website for more details.
August 17 - Why is positivity in Washington at 100%? Because the state has a data issue.
Since August 1st, Washington state has not reported its daily test tallies. This is because of issues with the state's disease reporting system. We rely on the COVID Tracking Project and their team aggregates the publicly available data from the state's website. Since no data is available, our calculation for a state's positivity [Cases / Total Tests] is 100%.
The state reports that the issue will be fixed by next week: "Updates are anticipated to resume the week of August 24th after we switch to the new methodology reporting total testing volumes rather than just the number of new individuals who got a negative or positive test result for the first time."
August 12 - PRESS CALL - INCIDENCE ADJUSTED TEST TARGET & ADDRESSING DATA DISCREPANCIES
Earlier today CovidExitStrategy.org, United States of Care, Resolve to Save Lives, and the Duke-Margolis Center for Health Policy held a press webinar. It included a "State of the States" which shared analysis on the different regional COVID-19 hot spots; more background on the new "incidence adjusted" test target; and a look at the data issues from California, Kentucky, and Washington.
You can view the video of press conference here.
Good news. We've incorporated the latest "estimated" ICU & inpatient bed data from HHS. This dataset is back and we'll continue to report our experiences with it.
It is also worth noting that the state of Washington has had data reporting problems since August 1st. They are only reporting new cases, not total tests. Unfortunately that means we are calculating their positivity rate as a 100%. Once the glitch/issue is fixed, our dashboards will update accordingly.
Over the past week we have been unable to update our columns for ICU and inpatient bed utilization. We continue to see inconsistencies and stale data coming from the HHS Protect System.
The data on the public HHS Protect website was last updated on August 3, 2020. HHS also makes these datasets available via HealthData.gov. The "estimated" patient impact dataset was last updated on August 4, 2020. We prefer this dataset because appropriate statistical analysis is applied to account for non-response and missing data. This is the dataset that we used from the CDC before the CDC to HHS switch.
The dataset for "reported" patient impact was updated last night (August 9, 2020), but continues to have inconsistencies. For example, in Rhode Island the dataset indicates that inpatient beds are 111% occupied. In the dataset pulled on August 6, 2020, multiple states were missing data. We are hoping these issues get addressed soon. Without good "reported" data, likely the HHS team is having issues creating their "estimated" dataset.
Since launching we've tracked two test targets for the United States: 500K tests per day and 4M tests per day. The first target was a baseline number of tests needing to be run to get a grasp of how the virus is spreading. The upper bound was an aspirational target for where the country needed to be.
We are removing the 4M tests per day target and replacing it with an "incidence based target". This new target adjusts based on a state's positivity rate. When the positivity rate is high, it means a state needs to be testing more. When the positivity rate is low, it means a state can test less, but should not dip below its proportion of the 500K tests per day that the US needs to do. The target positivity is 3% or lower.
Our main table has been updated to incorporate this target. Our supporting testing table has been updated as well.
We have also added a column that assesses if a state is able to efficiently conduct contact tracing. When positivity within a state is high, it means contact tracing is likely to be unsuccessful. When positivity is low, a state has a better chance of using contact tracing successfully.
The data for estimated ICU and inpatient bed occupancy are still not available. The HHS Protect site has not been updated, but there is a dataset on HealthData.gov that shares the daily "reported" data. Since this data is not complete, it does not always portray an accurate picture of how a state is doing. We rely on CDC/HHS to generate its "estimated” dataset to do that. For the time being, we recommend cross-checking these numbers with the ones reported on a state's official website to get an accurate picture.
The data for ICU and inpatient bed occupancy has not been updated since July 23. This is unfortunate as we are seeing hospitalizations increase in 29 states. Without this critical indicator, it is hard to assess how a state's health system is responding to the surge of cases.
July 24 - Inconsistencies in HHS Protect Data for ICU and Bed Occupancy
We have halted pulling in ICU and inpatient bed occupancy data from the new HHS Protect System. We will resume our data pulls when inconsistencies have been resolved.
July 23 - PRESS CALL - "UNCONTROLLABLE SPREAD, HHS/CDC DISCREPANCIES, MASK TIMELINES"
Earlier today CovidExitStrategy.org, United States of Care, Resolve to Save Lives, Covid19StatePolicy.org, and the Duke-Margolis Center for Health Policy held a press webinar outlining new data on COVID-19 surges, effectiveness of masks and also addressed the new policy of data being sent to HHS rather than the CDC. You can view the video of the webinar here and listen to the audio here.
HHS now makes the data available from its new system called HHS Protect. We've incorporated it and will refresh our columns as the data is updated.
Because the Administration requested all data from hospitals to be routed to HHS, our existing source of ICU and inpatient bed data from the CDC is no longer available. More details here.
Unfortunately our data source for ICUs and beds has been removed by the CDC. Our hope is this loss of critical public health information is temporary. HHS is instituting a new process for collecting information from hospitals. The aggregate data from that system should be made public.
As a country we've reached a record number of cases. We've added a new color to the scale: "Bruised Red". There were extremes that were not captured in our original scale. Our scale also has been adjusted to put more weight on "new cases per million" and "positivity".
.png)
You can see our definitions and criteria for each indicator and the color scale.
Unfortunately when a map becomes all "red", it becomes less useful. We will be making an update shortly that will adjust our color scale and how each state is graded. The shift will put more weight on "new cases per million" and "positivity". It will continue to include ILI, ICU availability, and testing throughput. It will deemphasize case growth.
We've added 3 new maps to accompany each of the sections below.
CovidExitStrategy.org, United States of Care, Resolve to Save Lives, and the Duke-Margolis Center for Health Policy held a press conference call outlining the trends and concerns in states across the country that have seen increases in COVID-19 cases in the past 14 days. You can listen to audio of the press conference here.
The color trend now takes into account a state's CASES PER MILLION PER DAY. If the incidence rate is low (less than 40) it will not turn a state completely red. This impacts: Alaska, Montana, Michigan, Maine, and West Virginia. They are now yellow instead of red because of their low incident rate.
The ICU and bed thresholds have been adjusted: red is > 80% occupied, yellow is between 80%-70% occupied, and green is < 70% occupied. The measure has also changed from "availability to "occupied" to match how state websites report this information.

Yesterday, CovidExitStrategy.org, United States of Care, Resolve to Save Lives, and the Duke-Margolis Center for Health Policy held a press conference call outlining the trends and concerns in states across the country that have seen increases in COVID-19 cases in the past 14 days. You can listen to an audio of the press conference here.
To better visualize how states are doing towards the two test targets, we've allowed the percentage bar to go past 100%.
Tip: If you are trying to filter multiple states in a particular table, you can type in "Florida Texas California" and it will just show those three states.
To quantify the burden on hospitals, we've added "CURRENTLY HOSPITALIZED PER MILLION" and the 14 day trend. This data is available for most states, except for Florida, Hawaii, Idaho, Kansas, and Tennessee.
We are also calculating 2 additional indicators from the official CDC guidance. You can see that work here.
Massachusetts and Michigan started to include "probable" cases into their case counts. This caused a spike in new cases reported in MA on June 1st and MI on June 5th. For the moment, we have removed the data points for those days.
New Jersey, New Mexico, and New York are green with decreasing cases, a low positivity rate, and meeting the baseline testing target. Unfortunately though, all of them have an elevated case count per million. New Jersey is at 100, New York at 78 and New Mexico is at 64. Ideally this number is below 40.
After 7 days, New Mexico has shifted to yellow because of a flattening of new cases (-4%). Today will be New York's second day in the green with cases decreasing (-34%) and testing meeting the baseline target. However, it is worth noting that New York has an elevated number of cases per million (83). New Hampshire was briefly in the green yesterday, but back to yellow because of flat cases (-3%).
Our team is processing the latest guidance from the CDC on how to calculate if a state meets each of the gating criteria and how they shift between phases. It is thoughtful and will take some time to incorporate. For the time being, our red, yellow, green scale will indicate how a state is trending on the key measures that are a part of the White House criteria.
Using publicly available data we have adapted the criteria from Resolve to Save Lives into an alert system. We have created a section on the site where you can preview that.
Today, Michigan shifts to red because of an increase in cases (+8%).
New Mexico has met the criteria for 3 days in a row.
Guidance was released by the CDC yesterday on how they recommend scoring each measure. Our team is reviewing it. We'll share an update when we incorporate it.
This will be the third day that Michigan meets the criteria.
This will be the second continuous day for New Mexico.
This will be the second day that Michigan has met the criteria.
New Jersey was green on 5/16 and 5/17, but returned to yellow because its testing throughput dropped.
New Mexico returned to green because cases are decreasing (-11%).
5/17 is the first day that Michigan has met the criteria. This will be the second day for New Jersey.
New Mexico returned to yellow because cases are flat (-4%).
It is worth mentioning that both Kentucky and North Dakota are now red because cases are increasing.
5/16 is the first day that New Mexico and New Jersey have met the criteria.
While New Mexico's 14-day cases is decreasing, it is doing so at a very slow rate (-8%).
New Jersey has met the criteria with cases decreasing sharply (-55%), but is seeing 129 cases per million people per day. This is really high and should be closer (or lower) than 40.
As a reminder, no state had held on to the criteria for more than 3 days straight.
North Dakota was green on 5/12, 5/13, 5/14. Kentucky met all the criteria briefly for a day on 5/13.
North Dakota was steadily decreasing in cases over the past 3 days, but based on the state's report today, its 14-day cases flattened. So it shifts to yellow.
Kentucky briefly met all the criteria on 5/13, going from red to green. A big swing because it reported a large number of tests processed and went from cases increasing to decreasing for the past 14-day period. The state dropped to yellow on 5/14 because the number of tests it was doing dropped below the testing target. It continues to stay yellow because the 14-day case trend has flattened.
It is expected that states will fluctuate as they navigate this crisis. What's key is preserving the progress that they've made.